4x4 Chess
Metrics
Each position is stored in a database table as a single value. The meaning of this value is different from one table to another, depending on the metric used. I experiment with these metrics in 4x4 chess (from larger to more compact): DTM, DTX, DTC, DTZ, WDL.
Metric Spectra
The following chart shows the relative abundance of positions with each metric value among all unique legal positions with 2 to 8 pieces. Four metrics are compared (DTM, DTX, DTC, DTZ). The horizontal axis corresponds to the metric value, in the order: draw, checkmate, win in 1, loss in 1, win in 2, loss in 2, and so on. The vertical axis shows the relative abundance, in percents out of all unique legal positions with 2 to 8 pieces (of which there are 60,767,560,037).
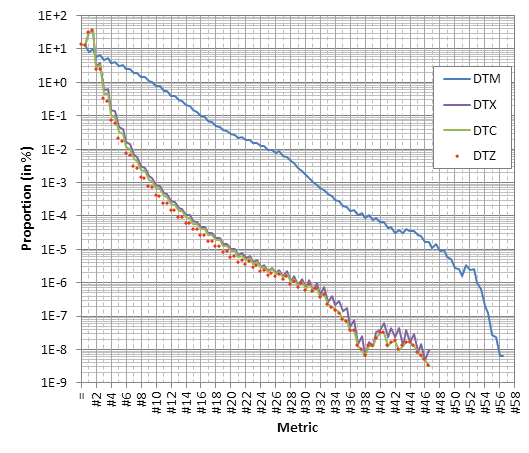
Clearly DTM is very different from other metrics, as it has much more abundant deep positions. I was surprised to find so small difference between DTX, DTC and DTZ.
The immediate practical consequence of the difference shown in this figure is different compressibility of tables in these metrics. We already know that DTM compresses poorly compared to other metrics, and this figure shows why.
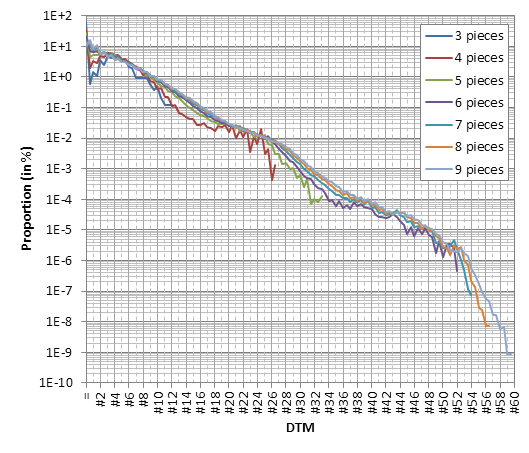
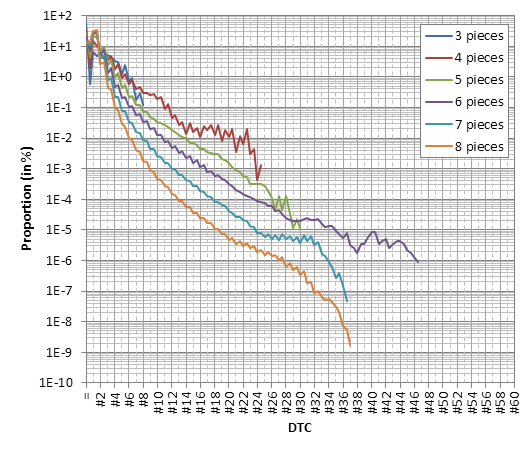
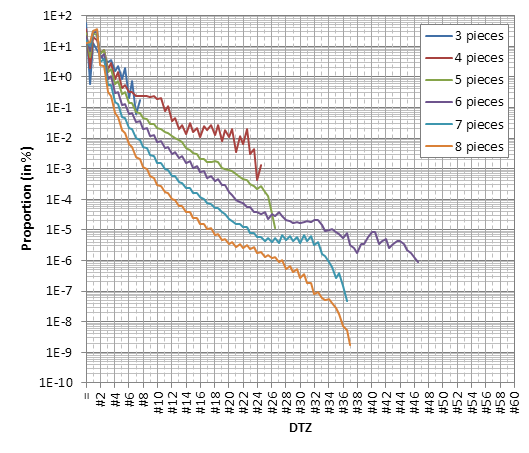
Metric spectra by number of pieces
These plots show the proportion of 4x4 chess position with each metric value among all unique legal positions with the same number of pieces.